Performance Metrics
Web Vitals is a Google initiative aimed at providing unified quality guidance for a good user experience. However, the tools for measuring performance are often complex and diverse, so Google proposed a subset called Core Web Vitals. Each Core Web Vital represents a unique aspect of user experience, can be measured at runtime, and reflects real-world experiences of user-centric critical outcomes.
Overall, Google has defined several important metrics, including Core Web Vitals, for measuring user-centric web performance:
Largest Contentful Paint (LCP): Measures the time from when the page starts loading to when the largest text block / image element is rendered on screen
Interaction to Next Paint (INP): Measures the latency of every click, tap, or keyboard interaction on the page, and based on the number of interactions, selects the worst latency as the single representative value describing the page's overall responsiveness
Cumulative Layout Shift (CLS): Measures the cumulative score of all unexpected layout shifts during the largest session window between page load start and when the page lifecycle becomes
hiddenFirst Contentful Paint (FCP): Measures the time from when the page starts loading to when any content is first rendered on screen
Time to Interactive (TTI): Measures the time from when the page starts loading to when its sub-resources have finished loading and it can reliably respond quickly to user input
Total Blocking Time (TBT): Measures the total amount of time between
FCPandTTIduring which the main thread is blocked and unable to respond to user inputTime to First Byte (TTFB): Measures the time between the user's request and the first byte of the network response. In short, TTFB is the sum of redirect time,
Service Workerstartup time,DNSlookup time,TCP / TLSnegotiation time, and request time. For details, see the Navigation Timing Level 2 network request processing model
How to quickly locate TTI using the performance tool
In a nutshell: The end time of the last long task between FCP and a quiet window lasting more than 5 seconds. If no long task is found, TTI equals FCP.

Two key concepts:
- A long task is a task lasting more than 50ms
- A quiet window means: no long tasks and fewer than two in-progress GET requests
Core Web Vitals
The industry de facto standard is the 2020 version, which primarily measures three aspects of user experience, namely Core Web Vitals:
- Loading - LCP
- Interactivity - INP
- Visual stability - CLS
A page with good user experience should at least ensure core metrics reach the "good" threshold.
LCP
LCP marks the point in the page loading timeline when the page's main content has likely finished loading. A fast LCP helps ensure the page's usefulness.
Page usefulness: has enough content rendered that users can engage with it
Why not use Speed Index (SI) or First Meaningful Paint (FMP)?
SI and FMP are both metrics tracked in Google Lighthouse (FMP was removed in Lighthouse 6.0+), but their problem is that they're overly complex and hard to explain, and often cannot correctly explain when the page's main content has finished loading.

LCP primarily measures the following content:
<img><image>within<svg><video>- Elements with
url() - Block-level elements containing text nodes
For good user experience, sites should aim for LCP under 2.5s on at least 75% of page loads.
There are rarely simple operations that can quickly improve LCP. Improving LCP often requires examining the entire page loading process and ensuring each step is optimized. Therefore, we need to break LCP into finer sub-steps.
A page loading process typically involves a certain number of requests, two of which are highly related to LCP:
- The initial HTML document
- The LCP resource itself
Therefore, LCP has four sub-steps that can be optimized during loading:
- TTFB
- Resource load delay: Time between TTFB and when the browser starts loading the LCP resource (0 if rendering large text with system fonts)
- Resource load duration: Time to load the LCP resource itself (0 if no resource is needed, e.g., system fonts)
- Element render delay: Time from LCP resource completion to full LCP element rendering
Eliminating Resource Load Delay
There's a good entry point for optimizing this: ideally, the LCP resource should start loading immediately after the first resource is parsed.
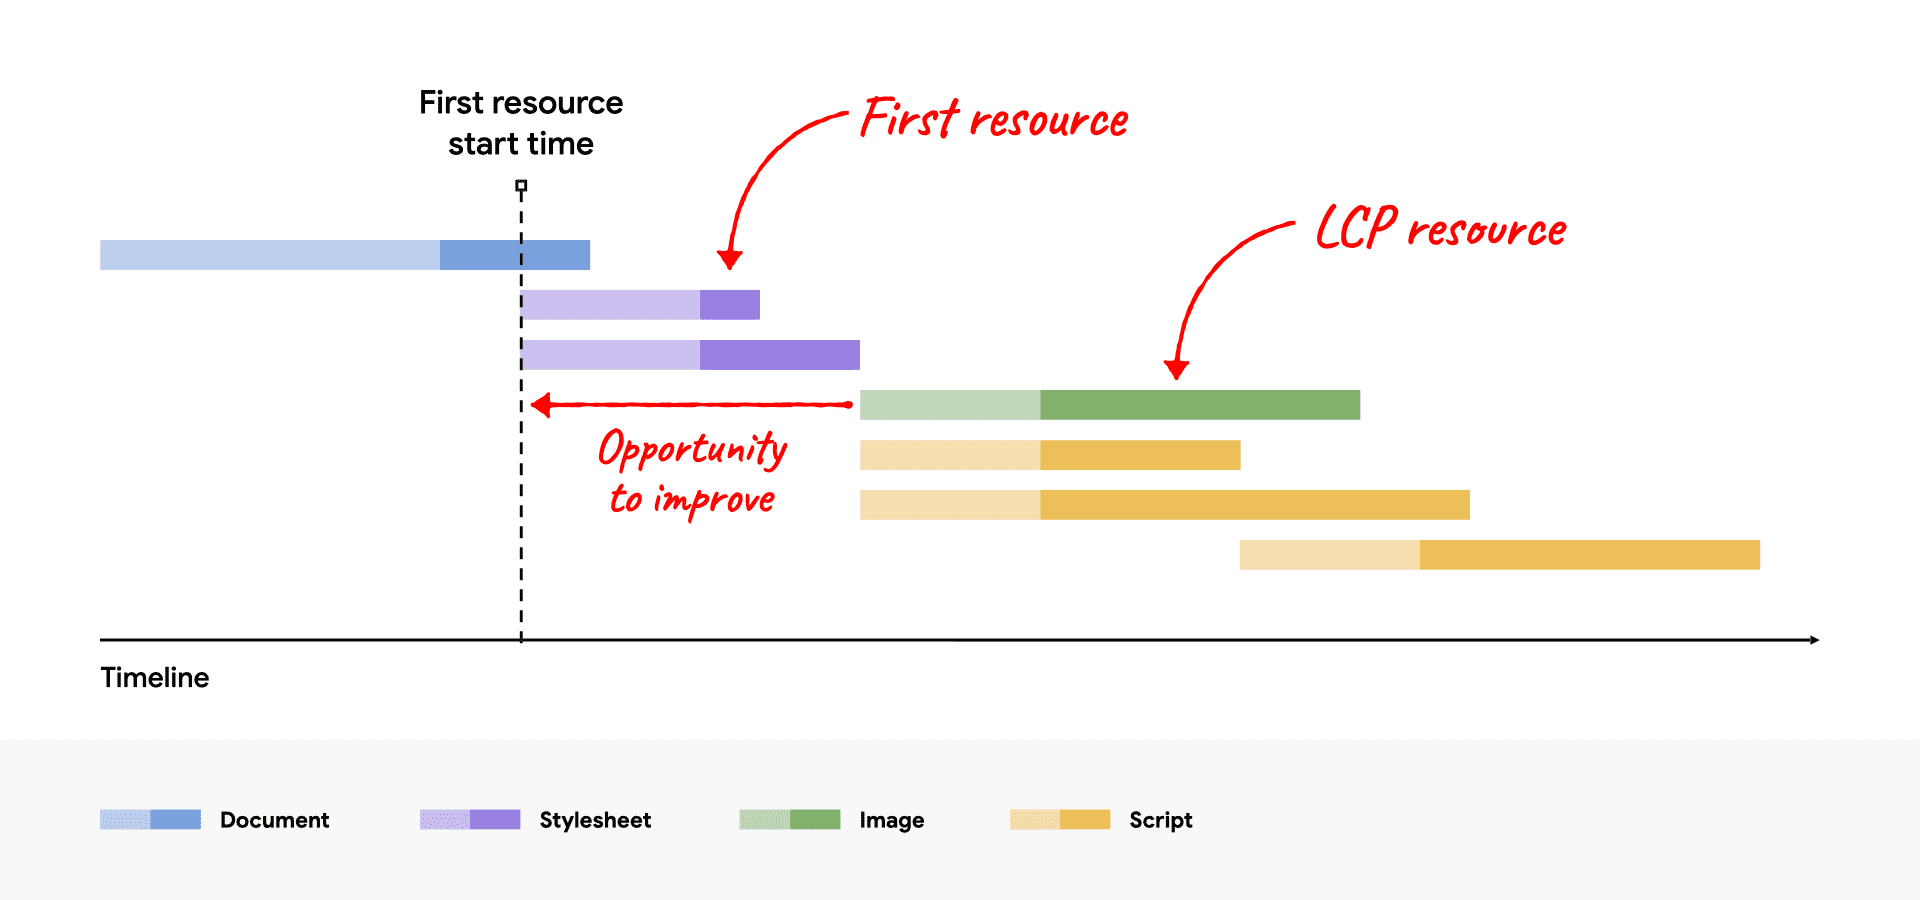
The idle time between when the Stylesheet starts parsing and when the LCP resource begins loading is the optimizable space.
For this, you can optimize load delay by preloading image resources or increasing resource priority:
<!-- Preload the LCP image with a high fetchpriority so it starts loading with the stylesheet. -->
<link rel="preload" fetchpriority="high" as="image" href="/path/to/hero-image.webp" type="image/webp">

<img fetchpriority="high" src="/path/to/hero-image.webp">
Eliminating Element Render Delay
After the LCP resource is requested, rendering may be blocked for several reasons:
scriptorstylesheetinheadis still loading- The
LCPelement hasn't been mounted to theDOMyet - The main thread is blocked by long tasks
Corresponding optimization strategies:
- Optimize CSS loading through
minify,compress, and removing unused CSS; optimizescriptloading in head through defer orinline script - Try using
SSR - Split long tasks. This is particularly important. Modern browsers basically render images on the main thread, so any long task blocking the main thread adds unnecessary element render delay.
Reducing Resource Load Duration
- Reduce resource size
- Reduce resource round-trip distance
- Reduce bandwidth contention
- Optimize cache-control-policy, use local caching
Reducing TTFB
CLS
CLS helps quantify how often users experience unexpected layout shifts. A lower CLS can ensure the page's delightfulness.
Page delightfulness: Are the interactions smooth and natural, free of lag?

Unexpected page changes typically occur when resources load asynchronously or DOM elements are dynamically added.
WARNING
CLS is only calculated when a visible element within the viewport changes its initial position. Such elements are called unstable elements.
If a new element is added to the DOM, or an existing element changes size, this change is not counted in CLS.
CLS focuses on shift, not change.
The main factors affecting CLS are:
- Images without dimension constraints
- Ads,
embeds, oriframeswithout dimension constraints - Dynamically injected versions of the above elements
- Web fonts
Therefore, CLS optimization can also start from these points:
- For
image,embeds, andiframes, add dimension constraints wherever possible - Avoid dynamically inserting these elements; if necessary, consider adding reserved space
- Avoid properties that cause
re-layoutsuch asbox-sizing,box-shadow,position - Font optimization is another complex topic. See here for optimization through
font-display: optionalor<link rel="preload">
re-layout, not reflow
What affects CLS is strictly not reflow but re-layout. The two concepts have subtle differences.
re-layout is broader, while reflow generally refers specifically to reflow in browser rendering.
Reflow doesn't necessarily affect CLS. For example, changing the width property of a child element of an existing element triggers browser reflow but doesn't affect CLS, because the element has corresponding reserved space and no layout shift occurred.
INP
INP observes the latency of all user interactions with the page and reports a value that all (or nearly all) interactions are below. A lower INP means the page can generally respond quickly and consistently to all — or most — user interactions.

Unlike CLS and LCP, INP is typically not a one-time measurement but spans the entire page lifecycle. INP cannot be monitored through PerformanceObserver, nor does it need to be. Most INP measurements occur when the page experiences significant delays.
For INP purposes, three types of user interactions are currently monitored:
- Mouse click
- Touchscreen tap
- Keyboard or virtual keyboard press
Other user interactions like hover, zoom, and scroll are not monitored as INP events, although some variants of these events may trigger click-like behavior in certain cases, which would then be captured by INP.
Once a slow interaction is identified and can be manually reproduced, the interaction can be broken down into three parts for analysis:
- Input delay
- Processing duration
- Presentation delay
Two main factors affect these three parts:
- Main thread occupancy affects input delay and processing duration
- Layout optimization affects presentation delay
Therefore, the most important optimization is first avoiding long tasks. This benefits both quick response to user input and execution of response scripts.
// Yield to the main thread through proper task scheduling
function splitTasks(){
  task1();
  setTimeout(()=>{
    task2();
  }, 0)
}
function yieldToMainThread(){
  return new Promise(resolve=>{
    setTimeout(resolve, 0);
  })
}
// Split large scripts into smaller modules through proper code-splitting to reduce Evaluating Time
// Use Web Workers to run scripts outside the main thread
Second, although using setTimeout to yield the main thread is a reasonable task scheduling strategy, you should still avoid starting too many timers on the main thread, because only when the main thread responds promptly can input delay be optimized.
Finally, presentation-level optimization often accounts for a large portion. In real application scenarios, many poor INP performances are due to page rendering consuming significant time.
// Avoid large, complex layouts and layout thrashing
function largeLayoutThrashing(){
  const testEl = document.getElementById('test-el');
  const style = testEl.style; // should be {width: 20px; height: 20px}
  testEl.style.width = '200px';
  testEl.style.height = '350px';
}
// Avoid forced reflow
function logBoxHeight () {
  box.classList.add('super-big');
  // To correctly return the element's offsetHeight, the page must first perform a reflow
  console.log(box.offsetHeight);
}
// Avoid rapid successive layouts
function loopResize(){
  // Puts the browser in a read-write loop
  for (let i = 0; i < paragraphs.length; i++) {
    paragraphs[i].style.width = `${box.offsetWidth}px`;
  }
}
Additionally, Blink spends roughly half of the total time calculating element styles on matching selectors, so reducing selector complexity and the number of elements to style helps. Therefore, CSS optimization also benefits INP.
.title {
  /* styles */
}
.box:nth-last-child(-n+1) .title {
  /* styles */
}
Other Common Metrics
FCP
FCP was once a core metric for measuring web performance, later replaced by the more semantic FMP, until LCP became mainstream. It remains an important metric for measuring web performance.
A good FCP should be within 1.8s.

Overall, there are several approaches to optimizing FCP:
- Eliminate render-blocking resources
- Minify CSS
- Remove unused CSS
- Remove unused JS
- Preconnect to required origins
- Reduce TTFB
- Control request count and request size
FCP can be measured with the following code:
new PerformanceObserver((entryList) => {
  for (const entry of entryList.getEntriesByName('first-contentful-paint')) {
    console.log('FCP candidate:', entry.startTime, entry);
  }
}).observe({type: 'paint', buffered: true});
TTFB
A good TTFB should be within 800ms.

Optimizing TTFB typically involves the following approaches:
- Use CDN
- Reduce page redirect count
- Use cached content wherever possible, set Cache-Policy appropriately
- Use Service Worker
TTFB can be measured with the following code:
new PerformanceObserver((entryList) => {
  const [pageNav] = entryList.getEntriesByType('navigation');

  console.log(`TTFB: ${pageNav.responseStart}`);
}).observe({
  type: 'navigation',
  buffered: true
});
TBT
TBT can quantify a page's non-interactive time before it becomes interactive. A lower TBT ensures the page's usability.
Page usability: Can users interact with the page, or is it busy?
Considering average mobile device hardware, a good TBT should be below 200ms.
The optimization approach for TBT is broadly similar to INP but simpler, mainly focusing on long task optimization and reducing unused code.
Further Reading